I’ll also give practical setups (entries, stops, targets) and a short risk reminder.
Daily timeframe — technical read (short & useful)
Context & recent price action
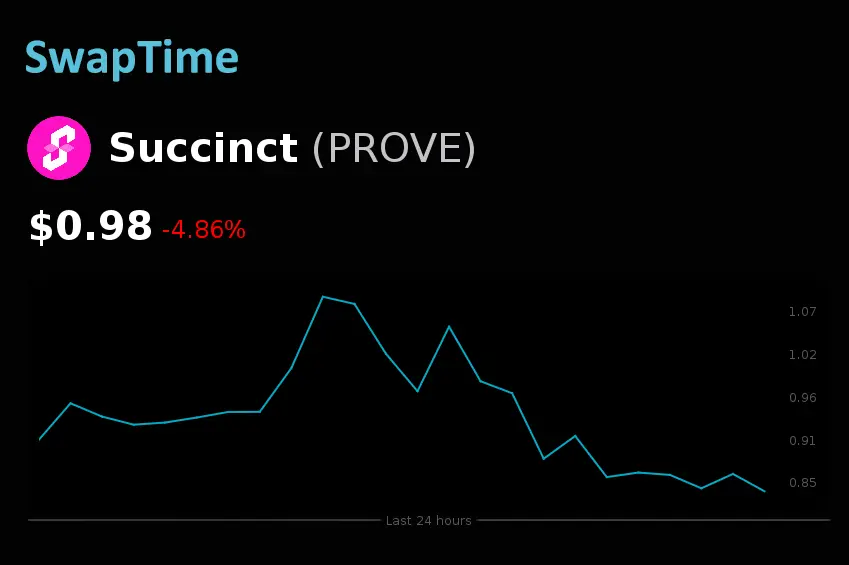
PROVE exploded after mainnet launch and exchange listings, briefly spiking to about $1.50 then retracing to the $1.0–$1.3 area (high volatility on listing).
Current live-price context (for reference): roughly ~$0.9–$1.2 depending on venue; 24-hour volumes have been very large on launch/listing days.
Momentum (RSI / MACD)
RSI (daily): on many post-listing scans RSI showed sharp swings — initial overbought then fast retracement. After that move RSI typically drifts back toward neutral (40–60) while price consolidates — watch for RSI > 60 (bullish continuation) or < 40 (weakness).
MACD (daily): short-term MACD behavior is aligned with the volatility: MACD may have shown a fast bullish spike at listing, followed by a potential convergence/crossover during pullback. Use a MACD histogram fade or a fresh bullish crossover as confirmation of resumed uptrend.
Moving averages & trend
Key MAs to watch: 21/50/200 daily. Currently the structure is transitional (price moved above short MAs during the pump, then pulled back toward them). If price holds above the 21–50 daily band, bias stays bullish; losing the 50 → increases odds of deeper retrace. (This is standard MA logic; see price/volume context above.)
Volume spiked on listings — high volum
e during the move to $1.5 then heavy distribution on the retracement. That suggests both strong interest and profit-taking; watch for declining volume during consolidation (healthy) vs renewed volume on a breakout (confirmation).
Price structure & patterns (daily)
Bullish pennant / accumulation / symmetrical triangle interpretations are being reported by analysts — this fits a classic listing-pump → consolidation pattern. A clean breakout above the pennant/triangle high would target a measured move (projected target near prior expansion levels; analysts pointed to ~$1.5–$1.6 as upside reference). A clear breakdown below the pennant lower trendline (and below major support) would invalidate the bullish breakout scenario.
Key daily support & resistance (practical levels)
Immediate support: $0.95–$1.00 (psychological / short-term).
Next stronger support: $0.77–$0.90 (areas noted in coverage as important).
Resistance to clear for bullish continuation: $1.20–$1.50 (recent highs and distribution zone). Break > $1.50 would be very bullish on daily view.
Daily trade idea (example)
Bullish (breakout) plan: Wait for daily close above $1.20–$1.25 on rising volume + MACD bullish momentum / RSI >50. Entry: breakout candle close. Stop: daily close back below breakout candle low or ~10–15% below entry. Targets: $1.50 first, then measured extension if momentum continues.
Bearish (failure) plan: If price breaks daily below $0.77 on volume and MACD turns negative, consider short / protective sell; stop above the failed-level; target near $0.50–$0.60 (measured move from pattern failure).
Hourly timeframe — technical read (practical intraday)
Availability & recommendation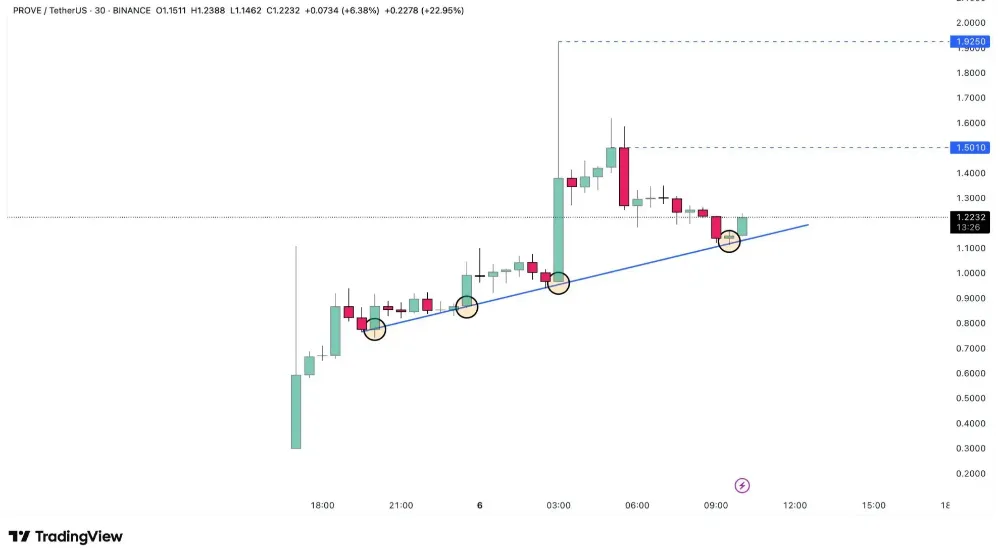
Most public writeups focus on launch/4H/daily structure. Live hourly signals (exact MACD / RSI values) move fast — to get accurate H1 readings you should check a live chart (TradingView or exchange chart) because intraday indicators change candle-to-candle. I recommend loading the PROVE pair on TradingView for H1 scans.
Typical H1 patterns & what to watch
Momentum cross (H1 MACD / RSI): look for MACD histogram rising from negative → positive on H1 and RSI climbing above 50 for a short-term buy. A bearish H1 MACD cross while daily remains neutral/bullish is simply short-term weakness (possible pullback to the daily support band).
VWAP / 21 EMA (hourly): intraday traders often use VWAP and 21 EMA as dynamic S/R. Price staying above hourly 21 EMA + VWAP = intraday bullish. Loss of those often leads to re-tests of daily support. (Check your chart’s VWAP + EMA on H1.)
Volume confirmation: intraday breakouts must be accompanied by above-average hourly volume to have follow-through.
Practical H1 setups
Scalp long: Wait for pullback to hourly 21 EMA or VWAP with H1 RSI > 40 and MACD histogram showing momentum pick-up. Tight stop below the intraday swing low. Small targets (3–6% intraday) or trail stop.
Momentum play: Enter on an hourly candle close above a short consolidation (e.g., 1-hour pennant/flag) with volume spike and MACD rising. Stop under the breakout candle; target the measured move.
Quick checklist (what to watch now)
Daily: hold above $0.95–$1.00 for constructive base; breakout > $1.20–$1.25 on rising volume = bullish.
Hourly: watch 21 EMA / VWAP + H1 MACD/RSI — these give clean intraday entries (use TradingView).
Volume: continued high volume on upticks supports sustainable moves; high volume on down moves indicates distribution / weaker structure.
Event risk: listings, airdrops, and mainnet headlines drive large short-term swings — be prepared for fast volatility.
Short risk & method note
This is technical analysis only — not investment advice. Crypto listing events create outsized noise; use position sizing and stops. Indicators (RSI/MACD/MAs) are confirmatory — always wait for price + volume confirmation before committing large size.